Monday, November 11, 2013

The Half-Empty Promise of Big Data

Anybody who works in a high-tech industry or product development knows that “big data” is one of today’s hottest buzz words. As I sat through numerous panel discussions and education sessions at a technology conference last week, “data mining,” “big data,” or “analytics” worked their way into almost every talk, no matter the subject. The typical context was that “big data is the key to solving this problem,” or “Data mining is the new Holy Grail in our industry.” Except in many cases these expectations are probably unrealistic.

Data mining is the analysis of large quantities of data to extract previously unknown interesting patterns and dependencies. Conventional thinking is that we can now mine mountains of data generated in our increasingly connected world, piece together important relationships and amazing connections that we never knew existed, and change the world. Or so they say. As a quantitative number cruncher and data geek, I see the potential.

But I also see a big pitfall in this thinking which is rarely talked about. Quite simply, most data being collected is simply not that useful. It's mundane personal data (locations, what websites a person visited, what purchases they made), and mining large sets of mundane data will produce some rather humdrum results at best. As an example, consider the shopper club cards used by most grocery chains. After analyzing billions of purchases by millions of people over the past two decades, what have the stores learned? That some people buy Pop Tarts in addition to flashlight batteries before a big storm. Interesting? Perhaps. World changing? Hardly.

The best applications of big data that I’m familiar with do not entail data mining at all, which has become a buzzword, and gets misused to mean any type of large-scale data analysis. For example, predicting flu outbreaks real-time based on citywide emergency room visits is a great use of big data that has both health and economic benefits. But it's not data mining. It's just plain old data analysis, with certain input variables that are predictive of an output variable. There is nothing unlikely or surprising about these relationships, but we are now able to query data in real time from sources that were previously unavailable or unconnected.

There are many great uses for big data, but people in high-tech industries and product development have developed unrealistic expectations, particularly for data mining. Most data being collected is simply not that useful, and this leads to the half-empty promise of big data.

Thursday, September 5, 2013

Predicting Mash Efficiency in an "Igloo-Style" Homebrew System, Part 2

As follow-up to the last blog entry, I’ve updated my mash efficiency prediction model with 6 more batches of beer, doubling the sample size. Variables were described in the previous article, and I also added a new variable called "Experience," which is really just the batch number on my new system. All input variables and the resulting mash efficiencies are shown in Table 1.

I analyzed the data using the same ordinary least squares regression (OLS) technique described in Part 1, but this time the resulting model was highly predictive of mash efficiency. OLS results are shown in Table 2, where it's seen that the most significant variable by far is Experience on the new system, as the magnitude of its t-stat is much larger than any of the others. Grain Crush is also significant, and Average Mash Temperature is approaching statistical significance. (As a rule of thumb, a t-stat whose magnitude is 1.96 or greater indicates statistical significance.)


Using the coefficients from Table 2, I built a mathematical model for mash efficiency,
and the model's predicted mash efficiencies are plotted against the actual mash efficiencies in Figure 1. In a perfect model all points would lie directly on the diagonal line, and this model's points, shown by blue diamonds, are very close to that line, providing visual support that the model is very predictive. In fact, the adjusted R-squared of the model is 0.89, which is outstanding and essentially means that the model accounts for 89% of the real-world variation.

My conclusions from this experiment are as follows:

1. It took a lot more batches than expected to start achieving consistent mash efficiencies. With the exception of the sixth batch on my new system, where I presumably got lucky, it took a surprising ten batches before results started looking repeatable. I don't know exactly what caused my learning curve, but I presume it has to do with sparging method, transfer times, stirring technique, and other "brewing moves."

2. When starting to brew on a new system, use the same mash thickness, mash temperature, and mash duration every time until you start to achieve consistent results. Until then, the effects of these variables will be imperceptible within the "noise" anyway.

3. Much of the brewing science and theory homebrewers consume is applicable only after you're able to achieve consistent mash efficiencies. On my last three batches I've finally averaged about 87% efficiency with an overall variation of less than 5%. If I can keep this the same for the next three or four batches, I may start to experiment with mash thickness, temperature, and duration again.

Overall, many homebrewers like myself enjoy the science aspect of this hobby, and can sometimes focus a bit too much on recording numbers out to third decimal place. But until your process is controlled enough to achieve consistent mash efficiencies, none of this really matters. Such control is harder to achieve than expected when using an "igloo-style" homebrew system, but keep aiming for it!

Monday, February 4, 2013

Predicting Mash Efficiency in an "Igloo-Style" Homebrew System, Part 1

Like most homebrewers who make the leap to all-grain brewing, I quickly learned that my 5-gallon sized partial-mash equipment just wasn't going to cut it for all-grain brewing; even when making 5 gallon batches of beer. For all but the thickest mashes, more volume is needed once you get beyond 13 or 14 pounds in the grain bill.

Therefore I assembled a 10-gallon system (pictured) by purchasing a couple of Igloo coolers from Home Depot, boring holes in them, and installing some good quality ball valves, fittings, and washers from McMaster Carr supply company. I also added a nice, stainless steel false-bottom to the mash tun. The system is not elaborate, but that's the point. It's simple, inexpensive, easy to clean, and most importantly, it works. I think of it as elegant.

Once I started brewing with my new system, one of the first things I needed to determine was my mash efficiency. I did this by making a reasonable guess for the first batch, then simply started brewing and taking measurements. After several batches I realized there was a lot of variation... efficiency ranged from about 60% to 80% across several batches. Fortunately I was meticulous about making measurements and collecting data, and I wondered if I could develop a reasonable prediction model for the efficiency of any given batch. The remainder of this article will explain my prediction model, and any homebrewer with an above average understanding of math or statistics can build a similar model.

The dependent variable in my model is obviously mash efficiency, expressed as the actual extract divided by the potential extract. If you use brewing software (such as Bradley Smith's fantastic and affordable BeerSmith) then all the better because the software calculates the actual mash efficiency based on your inputs. The four independent variables in my model are mash duration (minutes), mash thickness (quarts of water per pound of grain), mash temperature (degrees F), and mash pH. Mash duration is fairly self-explanatory in that longer durations lead to higher mash efficiencies. Mash thickness is a little more complicated. Although the rule of thumb is that thinner mashes have higher efficiency, the enzymes are also less "protected" and more sensitive to variations in temperature and pH, which can actually have a negative effect. The same can be said for mash temperature. Finally a mash pH of 5.3 is ideal, and efficiency drops as pH goes either up or down from this value.

Making good measurements in an igloo-style system can be a little more involved than it sounds since it is neither temperature controlled or recirculating. I have found that mash temperature varies within the mash tun itself, and to a lesser extent over the mash duration. Therefore I typically measure the mash temperature every 15 minutes using a K-type thermocouple, and for each measurement take the average of three data points (near the bottom, center, and top of the mash). These 15-minute measurements are then averaged to get the mash temperature. I use a similar approach for pH using a quality, temperature-compensating pH meter, although a single data point for each 15-minute measurement suffices as pH does not seem to vary within the mash tun.

Armed with some data (Table 1), I know that four variables (n) require a sample size of at least five (n+1),  so after brewing six batches on my new system (one more than required) I developed an initial prediction model using ordinary least squares regression. The results from this model are shown in Table 2, and the resulting equation is:


Predicted Mash Efficiency = 70% + [18% x (Mash Thickness - 1)] + [-0.93% x (Mash Temperature - 141°F)]
                       + (-0.13% x mash Duration) + (91% x |Mash pH - 5.3|)

The actual versus predicted results are shown graphically in Figure 1, and they look pretty good. But upon closer look, one notices right away that a couple of the coefficients don't really make sense. For example, mash efficiency should increase with duration, but the coefficient is negative. Efficiency should decrease as pH varies from 5.3, but the coefficient is positive. It turns out that none of the coefficients are statistically significant, as evidenced by their t-statistics and lower & upper 95% intervals in Table 2. In other words, the model is not very good, and the coefficients are not meaningful.

There are three possible explanations for the poor model: 1) There is just not enough data yet to understand the impact of each variable; 2) Most variation is caused by something other than the variables in the model; or 3) The variables are not independent; rather, mash efficiency is best predicted by some interaction between the variables. I am leaning toward 1 and 3 since I built the model from the bare minimum amount of data required, and because it's well-established that there is a complicated relationship between mash thickness and the other variables, as briefly explained above. I think explanation 2 is unlikely since the only other possible variables are grain crush size and potential extract values falling short of what's being used in the mash efficiency calculation. Regarding crush size, all my grains except for one batch were crushed on the same mill at the same setting. And I have no choice but to assume that the potential extract values published by the maltster are fairly accurate. 

Although my initial attempt to develop a prediction model for mash efficiency of my brewing system was unsuccessful, this exercise gave me insight into how much variation there can be using an "igloo-style" brewing system. I also developed some appreciation for how well commercial brewers must control their processes to get consistent results. I'll keep taking data and updating the model periodically, and I'll keep you posted if I come up with a prediction equation that becomes meaningful. Until then, I encourage all advanced homebrewers to take good data with quality instruments, experiment, and develop a deeper understanding of your own system and process. For me, that is part of the joy of this hobby.

Monday, January 7, 2013

Inventors With No Fear of Falling Off the Bike

Two bicycle-related stories caught my attention as I was catching up on some reading over holiday break. They will both be of interest to product managers and fans of beautiful design.

The first story is about Israeli inventor Izhar Gafni, who designed a cardboard bicycle... yes cardboard! Gafni's goal is to make production costs low enough to allow the bikes to be sold at retail for no more than $20. Such a low price could transform the lives of people living in poor countries who still walk miles per day to go to work or school, or to visit a doctor. He and his invention have been featured in the Huffington Post, Christian Science Monitor, and Dezeen, and it sounds like all the attention means that funding won't be the reason for success or failure of this unlikely, new product.

The other story is about a pair of Swedish inventors who turned everything that was known about bicycle helmets on its head (pun intended) and designed what they call the Hövding, or the "invisible bicycle helmet." Anna Haupt and Terese Alstin started developing this product as part of their Master thesis in 2005, and they haven't stopped since. The Hövding is an improbable blend of technology, materials, and fashion that may be making the major cycling gear manufacturers ask, "Why didn't we think of that?" Check out this 3 minute video to see how it works. Their company has received $10M in venture funding so far and now has 16 employees.

What makes these stories so appealing is that they are examples of industry outsiders who brought a unique perspective to a problem, then came up with a solution the so-called experts may never even have considered. This is humbling to those of us who work in product development and product management, as we are expected to be the experts and messengers of our markets. It's tempting to conclude that we should bring people or firms from other disciplines on board to help us, but if these brilliant ideas are 1 in a million (or even 1 in a hundred), what's the likelihood that such investments will actually lead to anything real? I think a more a sensible approach is to take the opportunities that come our way a little more seriously. Think twice before dismissing the email or phone call from the "young kid" with a big idea. And that silly prototype from the little startup company at the trade show? (It doesn't even have feature x, y, or z!) It might just be your next product.

Thursday, January 3, 2013

A Critical Thinker’s Perspective on Gun Control and Violence (Part 2)

As stated in Part 1 of this article, my first step in making an informed decision on the subject was to uncover as many facts as possible. Although one would think this would be easy, reality proved otherwise, as most of the Google results I looked at were clearly biased, taking positions on either side of the debate, then presenting facts to support that position. Such confirmation bias is not surprising; it is human nature. That's how our brains evolved, and a hallmark of solid, critical thought is the ability to minimize these biases. The preexisting beliefs I outlined in Part 1 shouldn't drive what evidence I choose to look at, or how I interpret that evidence.

One particularly useful source of information is the article Gun nation: Inside America's gun-carry culture published March, 2012 in the Christian Science Monitor, a paper known for its original reporting and fairly well-balanced perspective. From this article we learn several facts, including: 1) Gun-rights and gun ownership have expanded significantly over the past 10 to 20 years. For example, the number of concealed-weapon license holders in the US has gone from a few hundred thousand ten years ago to more than six million today; 2) Violent crime and intentional homicide have declined precipitously over the same time period. We are actually living in the most non-violent period in US history; 3) Because of this, not a single scholar in the field will claim that legalizing concealed weapons causes a major increase in crime; and 4) Recent Supreme Court decisions and the Obama administration's own policies have actually buttressed the right of Americans to own weapons; not hindered them. I found all of these facts non-intuitive, and they are exactly the opposite of what most people believe.

Another relatively objective source of information is an interview with Harvard psychology professor and author Steven Pinker, whose book The Better Angels of Our Nature: Why Violence Has Declined also turns conventional wisdom on its head. He points out that the rate of violent crime and intentional homicide in the US are about half of what they were twenty years ago despite increasing gun ownership and increased popularity of violent video games. He tells us that the rate of mass murder incidents has not increased since the 1920s, contrary to popular belief which is driven in part by improvements in communication and instantaneous reporting of news from any part of the world. In short, more people than ever go about their normal lives never being affected by a crime or violence. Finally, he cautions that our discussion about violence and murder should be focused on the 16,000 people who are murdered per year (45 per day) in the US that we never hear about, as opposed to the relatively few who are murdered in rampage killings like Newtown, as such incidents are still so rare that they are nearly impossible to predict and determine the cause.

The final part of my discovery process was compiling data and doing my own analysis. The sources above focus on the US, but it is a big world, and it is meaningful to look at homicide rates by country across a number of independent variables. I chose four variables which the literature and public commonly talk about as potential root causes of violent crime and homicide. They are:
1. Rate of gun ownership (G). Yes, people in other countries do own guns, and murders do occur.
2. Annual video game sales per person (V).
3. Income inequality (I) defined as the average annual income for the wealthiest 20% divided by the average annual income of the poorest 20%, or R/P 20%.
4. Percentage of the population that are males between the ages of 18 and 24 (M), as this group is more likely to commit murder than any other.

I considered including the use of assault-style weapons, but data was not readily available and even in the US, I learned that these weapons are used in a small percentage of all murders committed (2% to 7%, depending on the source).

Comparison nations are those with standards of living and lifestyles most similar to the United States; particularly Canada, most European nations, Australia, New Zealand, Japan, and South Korea. Data, shown in Table 1, comes from a variety of sources (noted below). Although this data is not rigorously vetted and may not be authoritative, I am assuming it is reasonably accurate for my purposes.

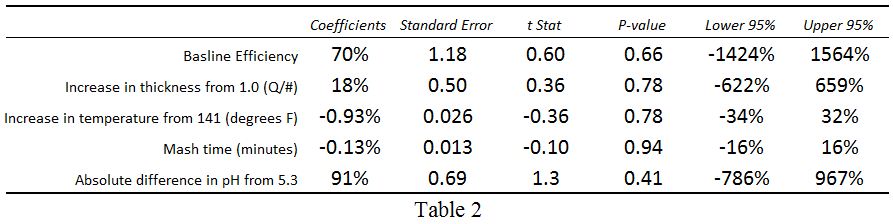
The data was analyzed using multivariate regression after normalizing each variable from 0 to 1 so that resultant coefficients could be directly compared. Prior to analysis, the distribution of each variable was qualitatively looked at, and all appeared reasonably normal except for the two highlighted values (gun ownership in the US, and video game sales in South Korea). Because of this, the analysis was performed both with and without the US and South Korea. Results without the US and South Korea are shown in Table 2. Coefficients for G and V are very small and have insignificant t-Stats, meaning the rate of gun ownership or video game sales has no measurable relationship to the homicide rate. Coefficients for I and M are larger, and they have marginal t-Stats, meaning income inequality and percent of the population that is young and male may explain some of the murder rate, but not much of it. The adjusted R-squared value of 0.22 is consistent with this conclusion, indicating that the 4 variables explain just 22% of the overall homicide rate across all countries. Inversely, almost 80% of the homicide is rate explained by something other than these 4 variables (or perhaps some combinations of these).

When we add the US and South Korea to the analysis (Table 3), the results become more complicated. Note that the adjusted R-squared value increases to 0.54, meaning the 4 variables now explain up to 54% of the overall homicide rate across countries. Coefficients for I and M also increase considerably, while t-Stats remain marginal. This means that the effect of income inequality and a young, male population may be larger than we previously thought, but we can't definitively draw that conclusion because there's either too much country-by-country variation or we don't have a large enough sample (or both). Finally, coefficients for G and V also become moderate with marginal t-Stats; just like I and M. Therefore our conclusion about the effect of these variables is the same as I and M, but there is probably even more uncertainty with G and V since the addition if just two data points completely changes the result.

So what does all this mean? It means that the problem is really complicated. What is not complicated is the reality that the homicide rate in the US is 2 to 7 times higher than other peer countries. We are much more likely to kill somebody to solve a problem. This is a fact. But although everybody has an opinion, nobody really knows why. The evidence deflates some arguments, simply says "maybe" on others, and even contradicts itself sometimes. It is easy to see how people on both sides of the guns and violence debate can cherry-pick data to support their position.

My analysis is admittedly overly-simplistic. There are many other independent variables that could be included such as unemployment, drug trafficking and other illegal activity, and gang violence. Gun ownership does not mean the same thing in all countries, as there is large variability in what types of weapons can be purchased, who can purchase them, and when and where they can be used. But simple doesn't make it invalid. Especially considering the whole point of this article was to provide an example of how to minimize confirmation bias, table preexisting beliefs, and use critical thinking skills to base conclusions on facts and evidence.

So what are my conclusions?

1. There simply is not a strong relationship between homicide rates and gun ownership or video games. Violent crime and murder rates have declined for 20 years, while gun rights and gun ownership have expanded, and violent video game playing has come of age. Data analysis across most countries results in effects that are small and statistically insignificant.

2. If there is a relationship between gun ownership and murder rates, it is uniquely American. There is something in the fabric of our country or our cultural psyche that drives us toward confrontation, violence, and guns to solve problems. Although violent crime has declined, our murder rate is still much higher than any other developed country. The mere presence of guns may not be the root cause, but whatever emotions, fears, or anxieties drive us to buy so many guns may be the same ones that drive us to so many killings.

3. Given those facts, I do not support contraction of gun rights on most weapons, as it would have no affect on crime rates. However, I would support increased regulation or bans on certain types of high-capacity assault weapons, with complete understanding that it would have little impact on overall crime. It would make a large percent of the American population feel safer, and that is a valid perspective on our civil rights. I.e. One person's right not to live in fear trumps another's right to say certain things, or to own certain types of weapons. (Interestingly, this same "makes me feel safer" argument is used by many gun advocates to justify concealed carrying of guns.)

4. We need to accept that gun ownership is something fairly unique to our country, just like 3 car garages and Sunday football, and begin to change the dialogue from for or against to safe and appropriate use. The NRA would probably be happy to lead this charge, and this would be the start of shifting the American psyche. Look at how quickly attitudes toward unprotected sex and smoking have changed in just a couple of decades, and I believe a similar shift could occur regarding the use of guns to solve problems.

5. As part of number 4, I would support state-level licensing to own and buy guns, with graduated requirements based on the lethal capacity of the gun. The process and education required to buy and use a large caliber weapon should be at least as rigorous as the one required to get a commercial driver's license. Both help ensure responsible behavior and public safety. This restricts a person's right to bear arms no more than studying and taking a driver's test restricts a person's right to drive.

6. Finally, I agree with Steven Pinker that the discussion on this topic needs to revolve on the 45 people who are murdered each day, every day; not on the rare, Newtown-like massacres. The individual murders are the ones that add up to 16,000 killed per year and the highest murder-rate in the developed world. As hard as it is to acknowledge, mass killings are unpredictable, random events that are nearly impossible to prevent. (However, I might change my mind on this one if 2011 ends up being the start of a trend, as opposed to a typical, random clustering of unlikely events.)

I encourage everybody to take some time, try to put your preexisting beliefs aside, seek objective or well-balanced information, and draw your own conclusions. They may be the same as mine, or different, but in either case they will be informed and provide the foundation for a real, productive discussion. That's what critical thinking is all about.

Data Sources:
Intentional Homicide Rate: Wikipedia list of countries by intentional homicide rate for most recent year available. Most numbers are 2010, with some 2008 and 2009.
Gun Ownership: Wikipedia number of guns per capita by country for 2007.
Annual Video Game Sales: Most data from Video Game Sales Wiki for 2008, with other sources used to fill in gaps.
Income Inequality: Wikipedia list of countries by income equality using R/P 20% from United Nations Development Program, 2008.
% of Population Male 18-24: Most data from Nation Master for 2010, with other sources used to fill in gaps.