Saturday, January 9, 2016

Mostly More of the Same at This Year's Consumer Electronics Show

The overall theme at this year's Consumer Electronics Show (CES 2016) seemed to be small steps and incremental change. There were no ground-breaking new products or technologies that caught my attention, and I left feeling uninspired.

There were way more drones (unmanned aerials, in CES parlance) than past years, with an entire section of the lower South Hall dedicated to them. FAA's new guidelines doesn't seem to have grounded this industry in the least, and the size of drones keeps growing.

Virtual Reality systems remain poised to be the next big thing, led by Oculus Rift who finally announced they will begin shipping product in March at a $599 price tag. The line to experience their product constantly snaked around corners, making them one of the popular stop for the second straight year in my estimation. Use of VR for gaming is pretty obvious, but I'm more interested in how this technology will be adopted in industrial and commercial applications, to perform hazardous work remotely for example.

4K displays were the norm, and keep getting larger and thinner, which is simply expected now and not necessarily groundbreaking. The 3D displays that were so prominent a couple years ago have almost disappeared.

The Internet of Things (IoT) buzzword continued its overuse trajectory this year, and has hopefully reached a climax. Every type of product imaginable now connects itself to a smart phone, and I counted at least thirty products that bill themselves as "The world's first [insert product idea here]." I totally get the long term potential here, but do I really need to adjust my mattress remotely or have an app that tells me if my toilet tank is leaking?

I attended the show with a particular interest in wearables and bio-sensors, but these seem to have stalled as well. Although there were more companies peddling health products and fitness bands than in the past, there's simply not much differentiation in the category. Focus seems to have shifted to style and fashion instead of features. Samsung highlighted their smart clothing line, but the sensors themselves seem convey basic things like temperature, motion, etc. with smartphone software performing the magic of converting this to calories burned and other (questionable) information. Perhaps the sensor technology required to make other types of biometric measurements accurately is just not there yet.

The biggest shift I saw from last year's CES is that autonomous vehicles are now going mainstream. This idea seemed pie-in-the-sky just a few years when the Google car started getting attention. Then luxury brands like Mercedes and BMW started autonomous programs. Now all of the automobile manufacturers have self-driving prototypes to various degrees, and we may see these on the market before we know it. Interestingly, Toyota also displayed a hydrogen-powered vehicle, which seemed like a blast from the early 2000s.

As a beer geek and homebrewer, and can't complete this article without making a mention of picoBrew. This Kickstarter-funded company had a great display and real-working product, from which they were brewing beer and giving out free samples. They target shipping the smaller picoBrew system ($1000) in mid-2016, and are already shipping their larger Zymatic system ($2000). As an advanced homebrewer, such a system would take all the fun out of brewing for more, but they're goal is to make homebrewing so easy that anybody can do it. Best of luck to them.

Overall my CES 2016 experience this year was a little underwhelming. I hope companies are saving some of their great new gear and tech for next year.

Thursday, March 12, 2015

TG Tech Briefs: Stories Worth Sharing for Week Ending March 7, 2015

Some recent tech stories that I find interesting and worth sharing.

The Face Detection Algorithm Set to Revolutionize Image Search If you’ve ever been involved in implementing automated facial recognition then you know the ability to identify faces from any angle, or when partially occluded, is problematic. These two researchers hope to change that.

Biometrics Researchers Race to Stay One Step Ahead of Hackers As much as we hate passwords, they’re not going anywhere soon. That’s because fingerprints and other biometrics might not be as secret as we think they are. Interesting article.

Europe Pivots Between Safety and Privacy Online If you’d like some insight into how the EU perspective on information privacy is different than the US, this is a great place to start. It’s just a whole different cultural perspective than in the US.

A Speedy Wireless Protocol Is Coming to Many Gadgets WiGig is up to 10 times faster than today’s WiFi. This technology is being pushed by Qualcomm and will supposedly be available by the end of this year.

The World's 50 Most Innovative Companies Many if the usual suspects are on this list, but there are many surprises to… Warby Parker? The list also demonstrates that innovation is not just limited to high-tech, but applies equally to retail, transportation, housing and even social activism. How did an upstart airline become India’s largest in just 10 years? By being different. There are some lessons to be learned here.

Saturday, February 28, 2015

TG Tech Briefs: Stories Worth Sharing for Week Ending February 28, 2015

Some recent tech stories that I find interesting and worth sharing.

12 Emerging Trends that Everyone Missed at CES Thomas Frye always has a unique and sometimes far-out perspective on things. For those interested, Frye’s DaVinci Institute is a local organization that hosts speakers and events for the geek-crowd. I’ve attended a few of his events, and they are affordable and usually interesting. Check them out.

Portable Battery Pack Market worth $11 Billion by 2020 The portable battery pack market is projected to grow by 20% per year for the next 5 years, $11B. Because this such a big market, we need to be realistic and accept that we will ride the coat-tails of other people’s technology and R&D investments.

Global Asset Management, 11 Years On This is a fun retrospective on what’ changed in battery-powered asset tracking over the last 11 years. What hasn’t changed? Battery technology for the most part.

Indoor Location Market worth $4.4 Billion by 2019 Here’s a sister industry that flies under the radar, but is 10 times the size of the criminal justice tracking market. The "Indoor Location” market is largely focused on retail, track and trace, and emergency management applications using tag-based, RF-based, and sensor-based technologies.

Speaking of indoor location, have you ever wondered why there is not a terrestrial or ground-based equivalent to the Global Positioning System? I have, and it turns out that there are two companies in the US developing such systems: UrsaNav and Locata. Such systems could reduce dependency on satellites (which can be taken out) and drastically improve location fixes indoors and other impaired areas. Only time will tell if these systems come to fruition.

Monday, February 23, 2015

TG Tech Briefs: Stories Worth Sharing for Week Ending February 21, 2015

Some recent tech stories that I find interesting and worth sharing.

Top Hacker Exposes Home Detention Bracelet Flaw A computer hacker in New Zealand has demonstrated how electronic monitoring bracelets can potentially be fooled by "spoofing". At a computer security conference, he demonstrated how a bracelet could be wrapped in foil, preventing it from reporting its location, then the signal mimicked by a laptop using a $500 transmitter and some custom software. What we don’t know is how knowledgeable this hacker was about the product he spoofed. Will demonstrations like this become more common as the electronic monitoring industry comes under increased scrutiny?

Newest US GPS 2F-8 Satellite Goes Active The fourth modernized Global Positioning System satellite launched this year has completed in-orbit testing and joined the constellation. The Boeing-built Block 2F series of a dozen spacecraft offers advanced atomic clocks, stronger anti-jamming, a new third civil signal, and longer design life. Three more GPS satellites are scheduled for launch in 2015. It’s nice to know that our GPS constellation is being upgraded on an ongoing basis.

Laser-Radio Links Upgrade the Internet This way-cool technology uses parallel radio and laser links to move data through the air at high speeds, in wireless hops of up to 10 kilometers at a time. This is being pitched as a cheaper and more practical alternative to laying new fiber optic cables, and is in trials with three of the largest U.S. Internet carriers. It is also being rolled out by one telecommunications provider in Mexico, and is helping build out the Internet infrastructure of Nigeria.

Wireless Gadget Recharging with Sound Waves Here’s yet another addition to the dozens of battery charging technologies under development. Under this approach, sound vibrations are harnessed from the air using piezoelectric transducers, which in turn convert that mechanical energy into electricity. This is all very theoretical at this time… a true R&D project, but interesting nonetheless.

TrackR Bluetooth Tag Sold with Luxury Designer Wallet at Macy’s Retailer Macy’s is now selling a $100 leather wallet from Royce Leather together with a Bluetooth tracking tag from TrackR to help locate the wallet if it gets lost. I thought this story was interesting not because of the technology (which is impractical for “true GPS tracking”) but simply because it illustrates how ubiquitous location-based services are becoming across so many different products. People generally understand the concept of location tracking, and I think that makes it more acceptable to society as a whole.

A Map of Every Device in the World That's Connected to the Internet This is just one those interesting pieces of info that seemed worth sharing.

Tuesday, December 23, 2014

TG Tech Briefs: Stories Worth Sharing for Week Ending December 20, 2014


There have been lots of stories over the past few weeks about wearables and sensor technology.

A New Chip Could Add Motion Sensing to Clothing A company called mCube has made a new kind of accelerometer that is small and cheap enough to lead to smart electronics in clothing and sports equipment.

First Look at Simband, Samsung's Health-Tracking Wearable of the Future & The Apple Watch May Solve the Usual Smart-Watch Annoyances Samsung’s new health tracker is equipped with six sensors, and its modular design means developers can add their own proprietary sensors as well. The six sensors it comes with can keep tabs on your daily steps, heart rate, blood pressure, skin temperature, and how much sweat your sweat glands are producing. The blood pressure sensor is a photoplethysmogram (PPG) sensor. The Apple Watch also has a PPG sensor.

Sweat Sensors Will Change How Wearables Track Your Health Researchers have discovered that perspiration may carry far more information and may be easier to stimulate, gather, and analyze than previously thought. This electronic sweat-patch uses paper microfluidics to wick sweat from the skin through a membrane that selects for a specific ion, such as sodium. Onboard circuitry calculates the ion concentration and sends the data to a smartphone. The electronics within the patch are externally powered, as in an RFID chip.

More Than Skin Deep & Artificial Skin That Senses, and Stretches, Like the Real Thing Both of these stories are about a thin, stretchable material that in which sensors and electronics can be incorporated. Making electronic devices that are skin-like will ultimately allow us to intimately integrate very advanced semiconductor technology and sensors with the body.

Radio-Controlled Mouse Hints at New Diabetes Treatment In this fascinating research at my alma mater Rensselaer Polytechnic Institute, mice were made to respond to a radio signals by releasing insulin. One day this might allow people with type 1 diabetes to use an app on their phone to alleviate their disease at a cellular level.

Finally, being in the electronic monitoring industry for criminal justice, as well as from Colorado, I get asked lots of questions of about marijuana detection. There are few press releases popping up about marijuana breathalyzers, such as this one from Washington State University and this one from Lifeloc. These stories are high on promises but low on details. What’s not stated is that concentrations of delta-9 THC in breath are so low that there is no reliable sensing technology outside of traditional, lab-based chromatography. My opinion is that this is a really a law enforcement issue; not an electronic monitoring issue. THC does not readily disappear from the body, so there are many reliable ways to determine if somebody has recently used marijuana. But there is no reliable chemical test to determine if a person is under the influence of pot right now, and I don't see one coming for some time.

Tuesday, December 16, 2014

TG Tech Briefs: Stories Worth Sharing for Week Ending December 13, 2014

Here are the latest product development and technology news that I find interesting.

New Smartphone Battery Goes From Dead To 70 Percent Charged In 2 Minutes,Scientists Say This team of researchers in Singapore have supposedly developed a way to charge batteries quickly by replacing the graphite normally used in the battery's anode (negative pole) with a gel made from titanium dioxide. They have applied for a grant to build a large-scale battery prototype for electric car tests, and say these new batteries could reach the market within two years.

New iPads Come with Special, Multi-Carrier “Apple SIM” & Apple's Quiet Attempt to Shake Up Wireless Carriers Could Benefit Us All Have you heard about the new “Apple SIM” that comes with latest iPad? It’s a software programmable SIM, meaning you can change carriers without swapping the SIM card. Participation is limited now, but Apple is trend-setter, so I imagine that we will all be able to advantage of such a SIM 2 or 3 years down the road. This could have a huge impact on how cellular carriers compete for business!

Gartner's Top 10 Strategic Technology Trends for 2015 There’s nothing earth-shattering, or even surprising, on Gartner’s list if you follow technology… but the concept of software-defined infrastructure is quite intriguing to me.

The'Internet of Things' Will Be The World's Most Massive Device Market And Save Companies Billions Of Dollars The growth in mobile computing and the Internet of Things (IoT) continues to amaze me... a projected 6.7 billion connected device shipments in 2019! (Yes billion, with 9 zeroes.)

Finally, I found the chart below from MIT Technology Review very surprising and worth sharing. This one chart provides great insight into the whole Net Neutrality debate, and explains why a few companies who need tons of bandwidth will be more than willing to pay-to-play. The impact, if any, on small users like us remains to be seen.

Wednesday, June 18, 2014

Measuring Product Development Productivity

I've recently been involved in a number of discussions about how to measure product development productivity, and I thought this was a great topic worth sharing. I've wrestled with this topic for much of my career, and have developed some pretty strong opinions on the subject.

First, I am not in favor of what I think of as "easily quantifiable but hollow metrics" such as lines of code, number of work items, number of drawings, number of ECOs, etc. Why? Because these measure effort and not results, and they may have little relationship to the success of the business. Remember, the whole purpose of product development is to help a business accomplish its goals. There are teams that can crank out tons of code that does not help the business in the least. Inversely, some teams may produce things that really matter to the business with a much smaller code base. Which team would you rather have?

Therefore, product development metrics need to be related to goals that are important to the business. These goals probably have something to do with increasing profits, revenue, or market share by introducing new products and features, but there are many other possibilities. Coming up with such metrics is admittedly easier said than done.
Here are two metrics that I have evolved into to over time:

1) Revenue from new products introduced in the past three years. This is pretty easy to measure and can be tailored to for any business. Perhaps it's 1 year instead of 3. Perhaps revenue is replaced by the percent of end-users who use new software features released in the past year. You get the idea.

2) ROI from development effort. This is much more complicated. Actually, the "I" part is pretty easy, but the "R" part can be tough; it will require debate and agreement among various stakeholders. This is also a long-term metric, as large projects may take years to produce any ROI at all.

I'm interested in your thoughts and comments. What metrics do you use?

Monday, November 11, 2013

The Half-Empty Promise of Big Data

Anybody who works in a high-tech industry or product development knows that “big data” is one of today’s hottest buzz words. As I sat through numerous panel discussions and education sessions at a technology conference last week, “data mining,” “big data,” or “analytics” worked their way into almost every talk, no matter the subject. The typical context was that “big data is the key to solving this problem,” or “Data mining is the new Holy Grail in our industry.” Except in many cases these expectations are probably unrealistic.

Data mining is the analysis of large quantities of data to extract previously unknown interesting patterns and dependencies. Conventional thinking is that we can now mine mountains of data generated in our increasingly connected world, piece together important relationships and amazing connections that we never knew existed, and change the world. Or so they say. As a quantitative number cruncher and data geek, I see the potential.

But I also see a big pitfall in this thinking which is rarely talked about. Quite simply, most data being collected is simply not that useful. It's mundane personal data (locations, what websites a person visited, what purchases they made), and mining large sets of mundane data will produce some rather humdrum results at best. As an example, consider the shopper club cards used by most grocery chains. After analyzing billions of purchases by millions of people over the past two decades, what have the stores learned? That some people buy Pop Tarts in addition to flashlight batteries before a big storm. Interesting? Perhaps. World changing? Hardly.

The best applications of big data that I’m familiar with do not entail data mining at all, which has become a buzzword, and gets misused to mean any type of large-scale data analysis. For example, predicting flu outbreaks real-time based on citywide emergency room visits is a great use of big data that has both health and economic benefits. But it's not data mining. It's just plain old data analysis, with certain input variables that are predictive of an output variable. There is nothing unlikely or surprising about these relationships, but we are now able to query data in real time from sources that were previously unavailable or unconnected.

There are many great uses for big data, but people in high-tech industries and product development have developed unrealistic expectations, particularly for data mining. Most data being collected is simply not that useful, and this leads to the half-empty promise of big data.

Thursday, September 5, 2013

Predicting Mash Efficiency in an "Igloo-Style" Homebrew System, Part 2

As follow-up to the last blog entry, I’ve updated my mash efficiency prediction model with 6 more batches of beer, doubling the sample size. Variables were described in the previous article, and I also added a new variable called "Experience," which is really just the batch number on my new system. All input variables and the resulting mash efficiencies are shown in Table 1.

I analyzed the data using the same ordinary least squares regression (OLS) technique described in Part 1, but this time the resulting model was highly predictive of mash efficiency. OLS results are shown in Table 2, where it's seen that the most significant variable by far is Experience on the new system, as the magnitude of its t-stat is much larger than any of the others. Grain Crush is also significant, and Average Mash Temperature is approaching statistical significance. (As a rule of thumb, a t-stat whose magnitude is 1.96 or greater indicates statistical significance.)


Using the coefficients from Table 2, I built a mathematical model for mash efficiency,
and the model's predicted mash efficiencies are plotted against the actual mash efficiencies in Figure 1. In a perfect model all points would lie directly on the diagonal line, and this model's points, shown by blue diamonds, are very close to that line, providing visual support that the model is very predictive. In fact, the adjusted R-squared of the model is 0.89, which is outstanding and essentially means that the model accounts for 89% of the real-world variation.

My conclusions from this experiment are as follows:

1. It took a lot more batches than expected to start achieving consistent mash efficiencies. With the exception of the sixth batch on my new system, where I presumably got lucky, it took a surprising ten batches before results started looking repeatable. I don't know exactly what caused my learning curve, but I presume it has to do with sparging method, transfer times, stirring technique, and other "brewing moves."

2. When starting to brew on a new system, use the same mash thickness, mash temperature, and mash duration every time until you start to achieve consistent results. Until then, the effects of these variables will be imperceptible within the "noise" anyway.

3. Much of the brewing science and theory homebrewers consume is applicable only after you're able to achieve consistent mash efficiencies. On my last three batches I've finally averaged about 87% efficiency with an overall variation of less than 5%. If I can keep this the same for the next three or four batches, I may start to experiment with mash thickness, temperature, and duration again.

Overall, many homebrewers like myself enjoy the science aspect of this hobby, and can sometimes focus a bit too much on recording numbers out to third decimal place. But until your process is controlled enough to achieve consistent mash efficiencies, none of this really matters. Such control is harder to achieve than expected when using an "igloo-style" homebrew system, but keep aiming for it!

Monday, February 4, 2013

Predicting Mash Efficiency in an "Igloo-Style" Homebrew System, Part 1

Like most homebrewers who make the leap to all-grain brewing, I quickly learned that my 5-gallon sized partial-mash equipment just wasn't going to cut it for all-grain brewing; even when making 5 gallon batches of beer. For all but the thickest mashes, more volume is needed once you get beyond 13 or 14 pounds in the grain bill.

Therefore I assembled a 10-gallon system (pictured) by purchasing a couple of Igloo coolers from Home Depot, boring holes in them, and installing some good quality ball valves, fittings, and washers from McMaster Carr supply company. I also added a nice, stainless steel false-bottom to the mash tun. The system is not elaborate, but that's the point. It's simple, inexpensive, easy to clean, and most importantly, it works. I think of it as elegant.

Once I started brewing with my new system, one of the first things I needed to determine was my mash efficiency. I did this by making a reasonable guess for the first batch, then simply started brewing and taking measurements. After several batches I realized there was a lot of variation... efficiency ranged from about 60% to 80% across several batches. Fortunately I was meticulous about making measurements and collecting data, and I wondered if I could develop a reasonable prediction model for the efficiency of any given batch. The remainder of this article will explain my prediction model, and any homebrewer with an above average understanding of math or statistics can build a similar model.

The dependent variable in my model is obviously mash efficiency, expressed as the actual extract divided by the potential extract. If you use brewing software (such as Bradley Smith's fantastic and affordable BeerSmith) then all the better because the software calculates the actual mash efficiency based on your inputs. The four independent variables in my model are mash duration (minutes), mash thickness (quarts of water per pound of grain), mash temperature (degrees F), and mash pH. Mash duration is fairly self-explanatory in that longer durations lead to higher mash efficiencies. Mash thickness is a little more complicated. Although the rule of thumb is that thinner mashes have higher efficiency, the enzymes are also less "protected" and more sensitive to variations in temperature and pH, which can actually have a negative effect. The same can be said for mash temperature. Finally a mash pH of 5.3 is ideal, and efficiency drops as pH goes either up or down from this value.

Making good measurements in an igloo-style system can be a little more involved than it sounds since it is neither temperature controlled or recirculating. I have found that mash temperature varies within the mash tun itself, and to a lesser extent over the mash duration. Therefore I typically measure the mash temperature every 15 minutes using a K-type thermocouple, and for each measurement take the average of three data points (near the bottom, center, and top of the mash). These 15-minute measurements are then averaged to get the mash temperature. I use a similar approach for pH using a quality, temperature-compensating pH meter, although a single data point for each 15-minute measurement suffices as pH does not seem to vary within the mash tun.

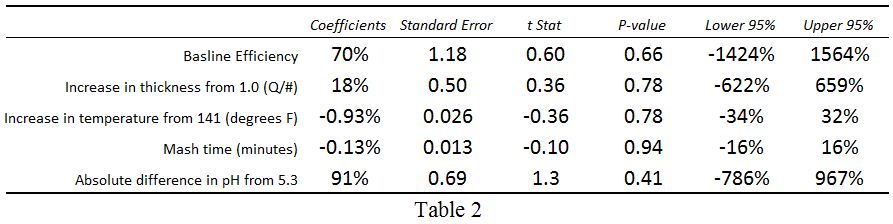
Armed with some data (Table 1), I know that four variables (n) require a sample size of at least five (n+1),  so after brewing six batches on my new system (one more than required) I developed an initial prediction model using ordinary least squares regression. The results from this model are shown in Table 2, and the resulting equation is:


Predicted Mash Efficiency = 70% + [18% x (Mash Thickness - 1)] + [-0.93% x (Mash Temperature - 141°F)]
                       + (-0.13% x mash Duration) + (91% x |Mash pH - 5.3|)

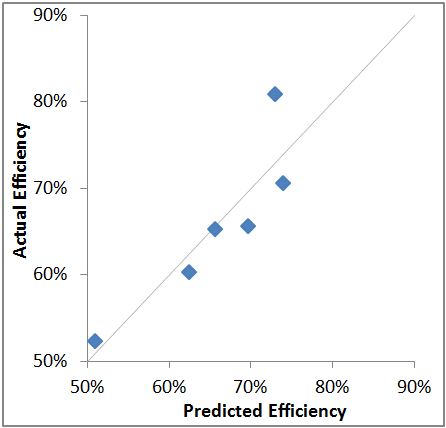
The actual versus predicted results are shown graphically in Figure 1, and they look pretty good. But upon closer look, one notices right away that a couple of the coefficients don't really make sense. For example, mash efficiency should increase with duration, but the coefficient is negative. Efficiency should decrease as pH varies from 5.3, but the coefficient is positive. It turns out that none of the coefficients are statistically significant, as evidenced by their t-statistics and lower & upper 95% intervals in Table 2. In other words, the model is not very good, and the coefficients are not meaningful.

There are three possible explanations for the poor model: 1) There is just not enough data yet to understand the impact of each variable; 2) Most variation is caused by something other than the variables in the model; or 3) The variables are not independent; rather, mash efficiency is best predicted by some interaction between the variables. I am leaning toward 1 and 3 since I built the model from the bare minimum amount of data required, and because it's well-established that there is a complicated relationship between mash thickness and the other variables, as briefly explained above. I think explanation 2 is unlikely since the only other possible variables are grain crush size and potential extract values falling short of what's being used in the mash efficiency calculation. Regarding crush size, all my grains except for one batch were crushed on the same mill at the same setting. And I have no choice but to assume that the potential extract values published by the maltster are fairly accurate. 

Although my initial attempt to develop a prediction model for mash efficiency of my brewing system was unsuccessful, this exercise gave me insight into how much variation there can be using an "igloo-style" brewing system. I also developed some appreciation for how well commercial brewers must control their processes to get consistent results. I'll keep taking data and updating the model periodically, and I'll keep you posted if I come up with a prediction equation that becomes meaningful. Until then, I encourage all advanced homebrewers to take good data with quality instruments, experiment, and develop a deeper understanding of your own system and process. For me, that is part of the joy of this hobby.

Monday, January 7, 2013

Inventors With No Fear of Falling Off the Bike

Two bicycle-related stories caught my attention as I was catching up on some reading over holiday break. They will both be of interest to product managers and fans of beautiful design.

The first story is about Israeli inventor Izhar Gafni, who designed a cardboard bicycle... yes cardboard! Gafni's goal is to make production costs low enough to allow the bikes to be sold at retail for no more than $20. Such a low price could transform the lives of people living in poor countries who still walk miles per day to go to work or school, or to visit a doctor. He and his invention have been featured in the Huffington Post, Christian Science Monitor, and Dezeen, and it sounds like all the attention means that funding won't be the reason for success or failure of this unlikely, new product.

The other story is about a pair of Swedish inventors who turned everything that was known about bicycle helmets on its head (pun intended) and designed what they call the Hövding, or the "invisible bicycle helmet." Anna Haupt and Terese Alstin started developing this product as part of their Master thesis in 2005, and they haven't stopped since. The Hövding is an improbable blend of technology, materials, and fashion that may be making the major cycling gear manufacturers ask, "Why didn't we think of that?" Check out this 3 minute video to see how it works. Their company has received $10M in venture funding so far and now has 16 employees.

What makes these stories so appealing is that they are examples of industry outsiders who brought a unique perspective to a problem, then came up with a solution the so-called experts may never even have considered. This is humbling to those of us who work in product development and product management, as we are expected to be the experts and messengers of our markets. It's tempting to conclude that we should bring people or firms from other disciplines on board to help us, but if these brilliant ideas are 1 in a million (or even 1 in a hundred), what's the likelihood that such investments will actually lead to anything real? I think a more a sensible approach is to take the opportunities that come our way a little more seriously. Think twice before dismissing the email or phone call from the "young kid" with a big idea. And that silly prototype from the little startup company at the trade show? (It doesn't even have feature x, y, or z!) It might just be your next product.

Thursday, January 3, 2013

A Critical Thinker’s Perspective on Gun Control and Violence (Part 2)

As stated in Part 1 of this article, my first step in making an informed decision on the subject was to uncover as many facts as possible. Although one would think this would be easy, reality proved otherwise, as most of the Google results I looked at were clearly biased, taking positions on either side of the debate, then presenting facts to support that position. Such confirmation bias is not surprising; it is human nature. That's how our brains evolved, and a hallmark of solid, critical thought is the ability to minimize these biases. The preexisting beliefs I outlined in Part 1 shouldn't drive what evidence I choose to look at, or how I interpret that evidence.

One particularly useful source of information is the article Gun nation: Inside America's gun-carry culture published March, 2012 in the Christian Science Monitor, a paper known for its original reporting and fairly well-balanced perspective. From this article we learn several facts, including: 1) Gun-rights and gun ownership have expanded significantly over the past 10 to 20 years. For example, the number of concealed-weapon license holders in the US has gone from a few hundred thousand ten years ago to more than six million today; 2) Violent crime and intentional homicide have declined precipitously over the same time period. We are actually living in the most non-violent period in US history; 3) Because of this, not a single scholar in the field will claim that legalizing concealed weapons causes a major increase in crime; and 4) Recent Supreme Court decisions and the Obama administration's own policies have actually buttressed the right of Americans to own weapons; not hindered them. I found all of these facts non-intuitive, and they are exactly the opposite of what most people believe.

Another relatively objective source of information is an interview with Harvard psychology professor and author Steven Pinker, whose book The Better Angels of Our Nature: Why Violence Has Declined also turns conventional wisdom on its head. He points out that the rate of violent crime and intentional homicide in the US are about half of what they were twenty years ago despite increasing gun ownership and increased popularity of violent video games. He tells us that the rate of mass murder incidents has not increased since the 1920s, contrary to popular belief which is driven in part by improvements in communication and instantaneous reporting of news from any part of the world. In short, more people than ever go about their normal lives never being affected by a crime or violence. Finally, he cautions that our discussion about violence and murder should be focused on the 16,000 people who are murdered per year (45 per day) in the US that we never hear about, as opposed to the relatively few who are murdered in rampage killings like Newtown, as such incidents are still so rare that they are nearly impossible to predict and determine the cause.

The final part of my discovery process was compiling data and doing my own analysis. The sources above focus on the US, but it is a big world, and it is meaningful to look at homicide rates by country across a number of independent variables. I chose four variables which the literature and public commonly talk about as potential root causes of violent crime and homicide. They are:
1. Rate of gun ownership (G). Yes, people in other countries do own guns, and murders do occur.
2. Annual video game sales per person (V).
3. Income inequality (I) defined as the average annual income for the wealthiest 20% divided by the average annual income of the poorest 20%, or R/P 20%.
4. Percentage of the population that are males between the ages of 18 and 24 (M), as this group is more likely to commit murder than any other.

I considered including the use of assault-style weapons, but data was not readily available and even in the US, I learned that these weapons are used in a small percentage of all murders committed (2% to 7%, depending on the source).

Comparison nations are those with standards of living and lifestyles most similar to the United States; particularly Canada, most European nations, Australia, New Zealand, Japan, and South Korea. Data, shown in Table 1, comes from a variety of sources (noted below). Although this data is not rigorously vetted and may not be authoritative, I am assuming it is reasonably accurate for my purposes.

The data was analyzed using multivariate regression after normalizing each variable from 0 to 1 so that resultant coefficients could be directly compared. Prior to analysis, the distribution of each variable was qualitatively looked at, and all appeared reasonably normal except for the two highlighted values (gun ownership in the US, and video game sales in South Korea). Because of this, the analysis was performed both with and without the US and South Korea. Results without the US and South Korea are shown in Table 2. Coefficients for G and V are very small and have insignificant t-Stats, meaning the rate of gun ownership or video game sales has no measurable relationship to the homicide rate. Coefficients for I and M are larger, and they have marginal t-Stats, meaning income inequality and percent of the population that is young and male may explain some of the murder rate, but not much of it. The adjusted R-squared value of 0.22 is consistent with this conclusion, indicating that the 4 variables explain just 22% of the overall homicide rate across all countries. Inversely, almost 80% of the homicide is rate explained by something other than these 4 variables (or perhaps some combinations of these).

When we add the US and South Korea to the analysis (Table 3), the results become more complicated. Note that the adjusted R-squared value increases to 0.54, meaning the 4 variables now explain up to 54% of the overall homicide rate across countries. Coefficients for I and M also increase considerably, while t-Stats remain marginal. This means that the effect of income inequality and a young, male population may be larger than we previously thought, but we can't definitively draw that conclusion because there's either too much country-by-country variation or we don't have a large enough sample (or both). Finally, coefficients for G and V also become moderate with marginal t-Stats; just like I and M. Therefore our conclusion about the effect of these variables is the same as I and M, but there is probably even more uncertainty with G and V since the addition if just two data points completely changes the result.

So what does all this mean? It means that the problem is really complicated. What is not complicated is the reality that the homicide rate in the US is 2 to 7 times higher than other peer countries. We are much more likely to kill somebody to solve a problem. This is a fact. But although everybody has an opinion, nobody really knows why. The evidence deflates some arguments, simply says "maybe" on others, and even contradicts itself sometimes. It is easy to see how people on both sides of the guns and violence debate can cherry-pick data to support their position.

My analysis is admittedly overly-simplistic. There are many other independent variables that could be included such as unemployment, drug trafficking and other illegal activity, and gang violence. Gun ownership does not mean the same thing in all countries, as there is large variability in what types of weapons can be purchased, who can purchase them, and when and where they can be used. But simple doesn't make it invalid. Especially considering the whole point of this article was to provide an example of how to minimize confirmation bias, table preexisting beliefs, and use critical thinking skills to base conclusions on facts and evidence.

So what are my conclusions?

1. There simply is not a strong relationship between homicide rates and gun ownership or video games. Violent crime and murder rates have declined for 20 years, while gun rights and gun ownership have expanded, and violent video game playing has come of age. Data analysis across most countries results in effects that are small and statistically insignificant.

2. If there is a relationship between gun ownership and murder rates, it is uniquely American. There is something in the fabric of our country or our cultural psyche that drives us toward confrontation, violence, and guns to solve problems. Although violent crime has declined, our murder rate is still much higher than any other developed country. The mere presence of guns may not be the root cause, but whatever emotions, fears, or anxieties drive us to buy so many guns may be the same ones that drive us to so many killings.

3. Given those facts, I do not support contraction of gun rights on most weapons, as it would have no affect on crime rates. However, I would support increased regulation or bans on certain types of high-capacity assault weapons, with complete understanding that it would have little impact on overall crime. It would make a large percent of the American population feel safer, and that is a valid perspective on our civil rights. I.e. One person's right not to live in fear trumps another's right to say certain things, or to own certain types of weapons. (Interestingly, this same "makes me feel safer" argument is used by many gun advocates to justify concealed carrying of guns.)

4. We need to accept that gun ownership is something fairly unique to our country, just like 3 car garages and Sunday football, and begin to change the dialogue from for or against to safe and appropriate use. The NRA would probably be happy to lead this charge, and this would be the start of shifting the American psyche. Look at how quickly attitudes toward unprotected sex and smoking have changed in just a couple of decades, and I believe a similar shift could occur regarding the use of guns to solve problems.

5. As part of number 4, I would support state-level licensing to own and buy guns, with graduated requirements based on the lethal capacity of the gun. The process and education required to buy and use a large caliber weapon should be at least as rigorous as the one required to get a commercial driver's license. Both help ensure responsible behavior and public safety. This restricts a person's right to bear arms no more than studying and taking a driver's test restricts a person's right to drive.

6. Finally, I agree with Steven Pinker that the discussion on this topic needs to revolve on the 45 people who are murdered each day, every day; not on the rare, Newtown-like massacres. The individual murders are the ones that add up to 16,000 killed per year and the highest murder-rate in the developed world. As hard as it is to acknowledge, mass killings are unpredictable, random events that are nearly impossible to prevent. (However, I might change my mind on this one if 2011 ends up being the start of a trend, as opposed to a typical, random clustering of unlikely events.)

I encourage everybody to take some time, try to put your preexisting beliefs aside, seek objective or well-balanced information, and draw your own conclusions. They may be the same as mine, or different, but in either case they will be informed and provide the foundation for a real, productive discussion. That's what critical thinking is all about.

Data Sources:
Intentional Homicide Rate: Wikipedia list of countries by intentional homicide rate for most recent year available. Most numbers are 2010, with some 2008 and 2009.
Gun Ownership: Wikipedia number of guns per capita by country for 2007.
Annual Video Game Sales: Most data from Video Game Sales Wiki for 2008, with other sources used to fill in gaps.
Income Inequality: Wikipedia list of countries by income equality using R/P 20% from United Nations Development Program, 2008.
% of Population Male 18-24: Most data from Nation Master for 2010, with other sources used to fill in gaps.

Monday, December 24, 2012

A Critical Thinker’s Perspective on Gun Control and Violence (Part 1)

The tragedy in Newtown has ignited a national debate about gun control, with calls to ban assault weapons making their way back into the headlines, and the NRAs proposal to put armed guards in schools getting widely ridiculed. Like most Americans, especially those with young children, those events of ten days ago have weighed on me heavily and prompted me to seriously think about the issues at hand. I deliberated about writing this blog entry at all (so as not to agitate my three readers) but I am tentatively doing so because I think a critical thinker’s perspective might be valuable in this emotion-filled discussion.

As background, I grew up in a rural area where hunting was popular and gun ownership was commonplace. I’ve fired guns and hunted myself a few times (although it’s been years), and I have many friends and acquaintances who own guns of all types, and who use them for sport shooting and hunting. I support citizens’ rights to own guns, and like many people I believe the gun control debate boils down to where we as a society want to draw the line between the types of arms that are reasonable for citizens to “keep and bear,” and the types of arms that are not. At one extreme are small caliber guns that hold just a few rounds and take some time to reload, and at the other extreme are weapons clearly designed for the battlefield. I actually tend to draw my line closer to the later because I think the second amendment is rooted in our Founding Father's belief that this right was needed as a check against tyranny; not as a means of ensuring people could always hunt and skeet shoot. Our British rulers attempted to disarm the colonists through various means, and these acts were viewed as an attempt to enslave the people. Although the very concept of US citizens rising up to overthrow a tyrannical government may sound absurd today, it is only because of the place and time we live in. This great American experiment is a mere 236 years old... a nanosecond in the history of humanity. Our short lives, memories, and experiences offer no help in predicting how things will be in 100 or 200 years, and history has numerous examples of democracies that have gone bad.

Now that I've made myself sound like a member of the Colorado militia, I will add that I do not own a gun and never intend to. I have not taught my two children to shoot, and I probably never will. One of my neighbors has a carry permit and holsters a handgun every waking moment, even when doing yard work, and this makes me uncomfortable. I wonder what's going on his head that makes him want to constantly protect himself in our crime-free neighborhood, and what would happen if my kids somehow crossed him when he was in bad mood? Although I think the NRA's missions of defending the second amendment and providing gun-safety training and education are reasonable, I'm annoyed by what I perceive as their overly simplistic interpretation of the constitution and black and white positions. Our right to bear arms, as with all of our other rights, is not absolute… it ends when it endangers the rights of others. I think the mantra "guns don't kill people; people kill people" is ridiculous and couldn't be retired soon enough. By this logic automobiles and opioids don't kill people either, so there is no need for speed limits or controlled substances. I'm also very troubled by the cold reality that a gun brought into a home for self-defense is twenty times more likely to be used in a suicide, accidental death, or intentional murder; almost always by a young male.

So it should be pretty clear that I'm actually quite conflicted on the subjects of gun violence and gun control, and the massacre in Connecticut initially pushed me more toward the left. Bans on assault weapons and high-capacity magazines seem like common sense. It just feels right. Right? Well, to a critical thinker, “common sense” is a code word for “opinion.” We all have different versions of common sense. Therefore I decided to uncover as many facts on the subject as possible, and to make as informed of a decision as possible based on the evidence. What I discovered is that this subject is as complex as they come, with endless dimensions to analyze and hard data available that can support or refute any side of any position. Some of my own opinions were supported, while others were dismantled. I’ll attempt to analyze this data and draw some conclusions in Part 2.

Sunday, November 11, 2012

Newspapers Can Rethink Their Business and Survive (A Product Managers View)

An insightful feature in this week's Christian Science Monitor about the ongoing struggles of the newspaper business made wonder if many people in this business understand the discipline of product management. If they did, the substance of these stories might be a little different.

We all know that the printed newspaper industry is in peril. Revenue has been drastically declining because classified and help-wanted ads have moved to the internet. Subscriptions continue to decline as more people get their news from free, online sources. According to many in the industry, this is the decline of modern civilization as we are losing sources of original reporting. There may be a kernel of truth to this, but in my opinion we are not losing too much.

The reality is that most people who subscribed to newspapers didn't actually read most of the newspaper anyway. They scanned the headlines, checked sports scores, and maybe read the Dave Barry column and letters to the editor, along with a comic or two. This type of short attention span news consumption was no different than what's happening online now, without the wood pulp. My 3 pound Sunday paper contained 2.5 pounds of mattress ads and 1/2 pound of fluffy special interest stories. And not just this year or last year, but for as long as I can remember! That's why I stopped subscribing; not because my attention span has gotten shorter.

So what's the kernel of truth in the dire prediction? Borrowing a quote from the referenced feature, it's that newspapers have historically provided "local journalism that holds leaders accountable and knits communities together," and they can continue to do so. The subset of people that were interested in this stuff still are; and they're still willing to pay for it. This is where the product management-thinking comes in. Good product managers know how to successfully match the needs of the market with their company's distinctive competencies. The market still wants news, but it has lots of ways to get most of it now... except at the local level. Newspapers have journalists, reporters, and delivery mechanisms that can provide that news, but they remain mostly focused on the wrong things... compiling content from around the world that is available from a thousand other sources.

What if newspapers focused 100% of their decreasing people, resources, revenue, and time on local news and journalism, and delivered it in an electronic-only format? That subset of readers who really care about the journalism would still be willing to pay for this, and although circulation would decline, so would costs. Over time, circulation might actually increase as the "Voice of Springfield" refocused itself on walking the walk, instead of being the voice of the world with 1 page about Springfield. In other words, newspaper companies need to stop thinking about how to prop up their historical business, and start doing what they're good at for the people that are willing to pay for it. If they do that, maybe they have a chance.

Monday, October 15, 2012

Has the Great American Beer Festival Gotten Too Big?

The coming of autumn means cooler temperatures, turning of the leaves, and for craft beer enthusiasts, it means the Great American Beer Festival (GABF). Those of us who live in Denver have the added bonus of the festival being held here every year since its inception in the late eighties. (Technically, I think the first couple were held in Boulder, but I'm splitting hairs.)

GABF is produced by the Brewer's Association (BA). According to BA, the primary purpose of GABF "is to educate the consumer about the quality and diversity in beer-styles and breweries that exist across the United States." Impressively, more than 500 of BA's 1,400 brewery members were in attendance this year, so thumbs up for diversity of beers! On the other hand, with 49,000 attendees opportunities to "educate" the consumer were limited at best.

Tickets to this year's GABF sold out in minutes. Even those of us eligible for the BA members-only  presale were in disbelief how quickly tickets were swiped up, and I was only able to score tickets for the Friday night session... happy hour. Most of the festival floor was shoulder-to-shoulder, and although the organizers did an amazing job of ushering so many people through so quickly, the crowd was just overwhelming.

For serious home brewers, intimacy and the ability to interact with professional brewers has been one of the GABF hallmarks. Because of the crowds, that intimacy and ability was gone this year.  It's nearly impossible to have a conversation with a brewer about aroma-hopping with Simcoe instead of Citra when there are twenty people lined up behind you waiting for a sample of beer. Most breweries are just rushing people through, and that's understandable.

My suggestions for improving GABF in the future are:
1. Hold more BA and AHA members-only events. BA and AHA members are some of the biggest proponents of craft beer. We tell everybody we know about great new beers, beer-styles, hops, and breweries. I think there would be a positive trickle down affect from giving us a little more access without the crowds.
2. Establish an education track in which serious home brewers and craft beer enthusiasts can learn more about brewing, ingredients, and the business of brewing. Sessions could be limited in size and taught by professional brewers or other respected people in the craft beer industry. We would be willing to pay more for such an opportunity.

The size of GABF this year is simply a reflection of the growing popularity of craft beer, and that's good. But in terms of educating the consumer via intimacy and direct interaction with brewers, I think the GABF has gotten too big. Until some new ideas are implemented, like the ones I've suggested above, I'll be skipping next year's GABF and instead going to the smaller and more intimate events and tastings that happen around town in the weeks leading up to the festival.

Thursday, September 27, 2012

AirTrain in Vain: Good and Bad Visual Design


BART Light Rail Map: An example of good visual design.
On a recent trip to San Francisco I was confronted with side-by-side examples of excellent and awful visual design.  I needed to get from the airport to downtown San Francisco via the light rail, or BART system. After finding my way to the BART station, the light rail map was exactly what I expected. Like almost all subway and light rail maps today, it's based on the style of Harry Beck's London Underground Tube map. This style is a classic example of elegant and effective visual design. One of the few criticisms is that these maps are not always geographically accurate, but this flaw is typically far outweighed by the fact that such maps are so easy to understand.

However, getting to the BART station was another matter entirely. The signs in the airport terminal directed me to the AirTrain, where I was confronted with a dreadful map. The first thing you notice on this map is all the white space, roads, and terminal buildings. Although the geographical accuracy may be useful to some, it probably does not need to be to scale, as less empty white space would make the stuff of interest much bigger and higher in resolution. The orange and green fill on the buildings serves no purpose whatsoever, except to distract the viewer. It is pure visual noise. Is there a train on this map somewhere? Since I am on a train and would like to know where get off, that would be fitting. Eliminate the colored fill, and place the emphasis on the AirTrain route itself.

AirTrain Map: is there a train in here somewhere?
After I finally figured out that I could access the BART station from the AirTrain, the next problem revealed itself. The train line leaving the BART station is shown in a reddish/ magenta color. Anybody who's done a little research in advance knows they are looking for the yellow line, but there is no yellow line on the map. Must I get on the red line instead? It turns out that the colors on the AirTrain map have nothing to do with the lines on the BART system. I guess somebody just thought red or magenta would like nice with the orange and green terminal buildings.

I confirmed this suspicion with a passerby and had about 10 minutes to kill before the next yellow line train arrived, so I decided to wander around the station and stretch my legs. That's when I came across another AirTrain map even more bewildering than the first one. Note the Zaxxon-style isometric projection of the AirTrain and terminals. Confused? Then just drop your eyes a little to the detailed top views and side view, where you can count the number of steps on each escalator and find the location of the nearest trash can. What is the purpose of this map? My theory is that it was drawn by a first year drafting or architectural student and placed in the station as a prize for getting the highest grade on the project.

Anybody up for a game of Zaxxon?
The entire purpose of visual display of information is to improve understanding beyond what can be conveyed with words. In these examples the BART light rail map does exactly that, while the AirTrain maps fall way short. They may actually create confusion and decrease understanding, which is the antithesis of good visual design. Map making is one of the oldest forms of graphical design, and great examples of professional maps surround us. It's perplexing how the maps for a key transportation link in a major metropolitan area could have missed this.

Tuesday, September 18, 2012

Product Managers Can Learn From Babies and Toddlers

A recent, wonderful article at fastcompany.com about Fisher-Price made me ask myself, "From a product manager's perspective, are babies and toddlers the ultimate user?" Let me explain. Fisher-Price is an 83 year old company that started out selling painted, wooden blocks for kids to play with. They have managed to stay successful and relevant through a delicate balance of adopting new trends and technology, and sticking to their roots. Among other things, the article describes Fisher-Price’s PlayLab proving ground for new products, where employees simply observe the way babies and parents play.

As product managers we are charged with being the voice of the market and being in tune with what users need and are willing to pay for. To know what potential customers want and will buy, we can simply ask them, but experienced product managers know this only gets you so far. People answer the questions you ask them; not the ones you don't ask them. They often tell you what they think you want to hear. Occasionally they lie. A good facilitator can sometimes break through these barriers and extract the truth, but it gets harder as the products, features, and solutions become more disruptive. This is particularly true for technology products. Potential customers will reliably tell you they prefer the white BMW over the green one, but try asking them about BMW's iDrive system when they've only used old, analog, discrete controls and it's a whole different scenario. Good luck with that.

To outwit our users, we product managers take a different tact. We don't ask them what they want; we watch them. We experience their worlds, understand what frustrates them, and try to gain insight into product gaps that force them to a work-around, substitute, or completely different product. As Yogi Berra said, "You can observe a lot just by watching." Armed with these observations, our development teams will come up with clever ways to address the problems.

This takes us back to Fisher-Price. When the users are babies and toddlers, there is no choice other than simply observing them. No questions to ask, and no answers to lead them to. You're forced to see what makes them tick and what frustrates them in a pure, unfiltered way. Does this make them the ultimate end-user? Perhaps.

Next time you visit a customer for a day-in-the-life-of visit, take a page from Fisher-Price's book: imagine your user in diapers, bring along some Goldfish crackers, and keep your mouth closed.

Tuesday, July 24, 2012

Presenting Data and Information: A Day with Edward Tufte


Last Friday I had the pleasure of attending Edward Tufte's lecture entitled "Presenting Data and Information" in downtown Denver.  Tufte is a professor at Yale where he teaches courses on statistical evidence and information design.  He's been called the DaVinci of data and graphical information, and one of his books (The Visual Display of Quantitative Information) is widely considered one of the greatest non-fiction works of the 20th century.  For many data geeks like myself, it is a go-to treatise referred to routinely.

Speaking of those books, all four were included in the $380 cost of the lecture, which made the price tag more palatable since they retail for $40 to $50 each.  And they are gorgeous!  Self-published by Tufte, he practices what he preaches and has produced what are truly heirloom quality collectibles.  Everything about these volumes is beautiful: the paper, type-faces, use of color, and printing quality.

So what about the lecture?  For those already familiar with Tufte's work and presentation philosophy, there was nothing new or earth-shattering offered.  The lecture could have been called "the world according to ET in six hours."  His disdain for Powerpoint is well-known, and he did not disappoint in reinforcing this.  Having said that, I truly enjoyed seeing his well-rehearsed and choreographed lecture, and it was nice to hear what he considered the most important take-aways from his four volumes.

My summary of those take-aways is as follows:
  1. All problems worth talking about are multi-dimensional.  They shouldn't be presented serially or one-dimensionally, which is what Powerpoint forces us to do.
  2. Start the presentation by giving a thorough data-dump on a high-resolution display (i.e. a printed document), and spend the first 15 minutes of the meeting telling people to read it.  For comparison's sake, printed documents have 6 to 7 times the resolution of most computer screens, and still twice the resolution as the latest retina displays.  Your audience isn't stupid.  They routinely read and understand charts and tables with 200 numbers or more in the newspaper, magazines, and internet.
  3. Follow that with a summary of the items you wish to highlight and discuss, and open it up for their questions and discussion.  The whole purpose of visually presenting data is to improve understanding, so that's what the focus of the meeting should be.
  4. You don't need to be a designer.  Find some good non-fiction reporting sources that you like, and model your documents after those.  Just copy the fonts, color-schemes, spacing, etc.  Sources that Tufte repeatedly referred to were the journal of Nature, espn.com, plos.org, the New York Times, and the Washington Post.
  5. Show your sources, and make your data available to anybody who wants it.
Would I pay $380 to see Tufte again?  Probably not.  But this is one of those things that I'm glad I did once.  (For more info, check out Tufte's website.)

Thursday, June 14, 2012

Beer Labels as Fine Art? Occasionally.

While recently enjoying a Sierra Nevada Ruthless Rye, I decided that I liked the beer label more than the beer itself.  Don’t get me wrong – I think this beer is good; it’s just not great.  It’s very restrained for a “rye-PA,” so I admire that Sierra Nevada is not joining the malt and hops one-upmanship game that so many craft brewers are playing.  But overall I found it to be, well… meh.  Apparently this is a replacement for their Glissade spring bock, which is a little surprising to me, as this rye ale just screams autumn.  As does its label.

And the label is striking!  Done in a style reminiscent of high-end graphic novels, the first thing you’re drawn to is the color scheme.  The hues are analogous enough to be soothing, but just far enough apart to throw you off a little and create an uneasy feeling.  The woman is haunting yet beautiful, like Patrick Nagel meets the witches from MacBeth.  Details, like the ominous clouds and strands of hair in the woman’s face, complete the picture.  The overall impression is chilling, hypnotic, and mysterious.


It turns out the artist is rock and roll illustrator Ken Taylor.  Best known for his album covers and concert posters, he dabbles in other areas too.  Somebody at Sierra Nevada must be a fan, so now he can add beer labels to that list.  Perhaps he’s a craft beer lover too?  Check out his portfolio.

Most beer labels have an illustration of an animal, landscape, person, or some other scene that matches the beer’s name.  It is usually competent and professional, but unmemorable.  Those who try to make the artwork take center-stage often go over the top in my opinion, producing art that’s better suited for the next Motorhead or Insane Clown Posse album cover.  (Sorry Coney Island and Ska Brewing.)  To me, the best beer labels are ones like those shown below.  The monochromatic, accented color schemes and easy to read fonts make beautiful, elegant designs.  But they are not art.  And that’s just fine, because it’s about what’s inside the bottle.


But Sierra Nevada may have changed the rules with their latest label.  Look at the crowded craft beer section in any well-stocked liquor store, and you’ll notice that Ruthless Rye really stands out.  That's the whole point of packaging.  You are drawn to it because it’s unique; it’s fancy, but it’s classy.  It’s a Bellagio in a sea of tacky Las Vegas strip hotels.

As the craft beer scene becomes more crowded, small brewers are struggling to come up with unique beer names and packaging that attracts attention.  I have a hunch that some of these brewers will follow Sierra Nevada’s example and start employing established artists.  For us beer-geeks who love art and design, this will be a nice bonus!

Please comment and share some your favorite beer label designs, and check out these links for more on this topic: The Pour Curator, and  15 Beer Labels we Love.

Friday, June 8, 2012

Product Development Use Cases and the Libyan Civil War

We all know that social media played a role in last year's Arab Spring, but I certainly didn't appreciate the extent of that role. This article from Technology Review is a fantastic read: Technology Review: People Power 2.0.  It provides some truly mesmerizing examples of how social media was used in the Libyan civil war to gather intelligence and receive critical weapons knowledge.   For product development professionals, it also leads to an interesting discussion regarding "use cases."

Most product development processes require "use cases" to be created very early in the process.  The purpose of doing this is to try and define all the ways a customer or user will interact with the product.  In other words, what will they use it for, and how do they want to go about doing that?  From my experience developing new products, I've concluded that there are typically three valid categories of use cases:  1) The ones the development team and product management come up with based on their experience; 2) The additional ones actual or potential customers and users come up (using interviews focus groups, demonstrations, etc,); and 3) The ones nobody came up with, but the product ends up being used that way none-the-less.  Kleenex and WD-40 are well-known, classic examples of the third category in which the unanticipated use cases led to vast, commercial success.  More recent examples are SMS text messaging and Gorilla Glass.


I have a hunch some of the examples cited in the Technology Review article fall into the third category as well.  In one example, Twitter was used to crowd source weapons knowledge, and an unusual type of landmine was identified in less than 40 minutes.  In another example a rebel commander received critical information about how a certain type of rocket launcher works from two civilians a continent away, using Skype.  This allowed his brigade to successfully attack the weapon.

I'm fairly certain Twitter never had a focus group to understand how their product might be used for weapons identification.  I'm also reasonably sure that Skype doesn't have an "intelligence" division tucked between the cubicles focused on small business and grandma.

So what does this all this mean regarding the way we develop new products?  I'm not ready to throw the baby out with the bath water.  Today's product development methodologies work pretty well, and most companies are able to bring new product to market faster than ever.  But product development professionals need to be opened-minded and acknowledge there are potential use cases that nobody can imagine... think of Donald Rumsfeld's "unknown unknowns."  I once worked for somebody twenty years ago whose philosophy was to "just throw a bunch of stuff at the wall and see what sticks."  Perhaps he has never been more right.